Premier League: An Analysis of Success Factors

Note that if you are using Jupyter Lab, you must install this extension for plotly visualisations to render properly.

Aims and Objectives

This report will focus on the factors that lead to winning in the English Premier League. I will first scrape some data from EPL's website and then attempt to pick out certain factors that contributed toward success. I will not be proving with certainty that certain factors make it more likely for a team to win; rather, I will attempt to find and present some evidence of it.

This topic has clear use cases in the realm of sports betting.

Scraping EPL's Website

Most of the Premier League data on Kaggle looks rather sparse. Navigating to the results page on the English Premier League's website, we can see lists of every match for every season. Clicking on a match reveals lots of nice details such as the minute mark at which certain events such as goals occurred, along with a stats section displaying info such as the number of passes made for each team. I would like to scrape this data somehow.

Dealing with Dynamic Content

There are problems that need to be considered when scraping this particular website. This website dynamically generates content, which means that I may have to resort to using a browser automation tool such as Selenium that is capable of executing JavaScript. Before I resort to an approach like that which I assume will involve more configuration and coding, I will attempt to reverse engineer how the website is dynamically requesting content.

One problem that you will notice if you follow the link above is that when we request a season via the dropdown menu, there appears to be no clear pattern for the number of the request parameter se. This may be some kind of season ID, but how can we know which season it relates to without using the browser? By inspecting the dropdown element, I notice the following HTML:
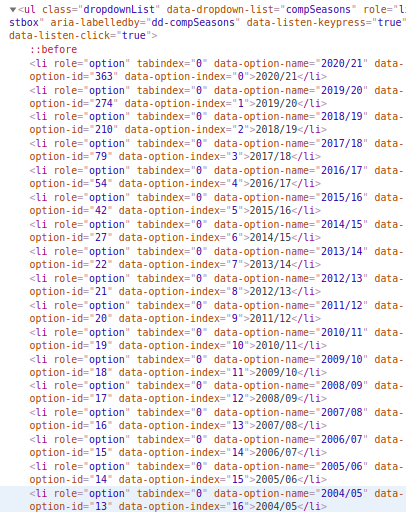
The se request parameter appears to correspond to the data-option-id attribute, so I now have a means of requesting each season's match list page.

Another problem is that the pages for individual matches are requested dynamically via JavaScript. However, the pages for individual matches follow a pattern that use a match ID which can be extracted from the match container on the match list page. In the same way that I can request season match lists, I can also request pages for indivual matches.

On an individual match page, the content of the Stats tab is generated via JS. This case is more tricky because the content is updated using AJAX and the URL is not altered. Looking at the Network tab in Chrome's Dev Tools, I see that it is requesting data from some API.

Requesting this URL outside of EPL's website results in a 403 Forbidden error. After doing some research, I discovered that this can be circumvented by setting the Origin header to EPL's domain. Sending the request using Postman gives me a JSON response with a bunch of data for the match. One problem that I notice is that an ID appears to be used for each team.
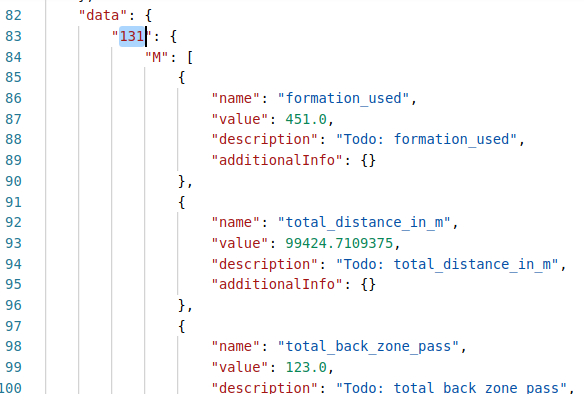
Looking back at the network tab in Dev Tools, I notice that other requests are being made to the same API. Requesting one of them gives me a JSON response containing team names and corresponding IDs.

One problem that I have overlooked is that the match lists for each season are also requested via AJAX. After spending too much time trying to figure out how this is done, I give up and decide to use a browser automation approach. I will use the Selenium API along with Chrome version 87 and its corresponding web driver. All is not lost; the information that I obtained above will likely still be of use.

Coding the Scraper

Here I begin to write my Scraper class and include a method to fetch the match IDs for a given season page. I am rendering all scraper-related code as non-executable markdown in this report. The script is named scraper.py. If you wish to run it yourself, you will need to have the web driver on your system's PATH.

import requests
import time
from selenium import webdriver
from bs4 import BeautifulSoup


class Scraper:

    def __init__(self):
        self.season_ids = [15,16,17,18,19,20,21,22,27,42,54,79,210,274,363]
        self.driver = webdriver.Chrome()
        self.run()
        self.driver.close()


    def run(self):
        pass


    def get_match_ids(self, season_id):
        self.driver.get('https://www.premierleague.com/results?co=1&se={season_id}&cl=-1')
        time.sleep(3)
        self.driver.execute_script("window.scrollTo(0, document.body.scrollHeight)")
        time.sleep(6)

        dom = BeautifulSoup(self.driver.page_source, 'html.parser')
        containers = dom.find_all('li', {'class': 'matchFixtureContainer'})

        match_ids = []
        for elem in containers:
            match_ids.append(elem['data-comp-match-item'])

        return match_ids

Additional matches are loaded via AJAX as we scroll down. Scrolling all the way to the bottom and waiting a few seconds loads them all.

A New Problem and Solution

I now find that I am unable to request the JSON data with Python's request package, even though it works fine in Postman when setting the Origin header. I set all of the same headers that can be seen in the browser, but it still does not work. EPL's website seems to be using some kind of sohpisticated mechanism to avoid web-scaping. I notice, however, that making a request on the command line with CURL works fine just as with Postman. I can use Python's os package to run the CURL command in a virtual shell and pipe the output to the programme.

def get_match_data(self, id):
        url = 'https://footballapi.pulselive.com/football/stats/match/' + id
        cmd = 'curl -H "Origin: https://www.premierleague.com" ' + url
        data = json.loads(os.popen(cmd).read())
        (team1, team2) = self.get_teams(data['entity']['teams'])
        team1['data'] = data['data'][team1['id']]['M']
        team2['data'] = data['data'][team2['id']]['M']

        teams = [team1, team2]
        for i in range(2):
            team = teams[i]
            team['stats'] = {
                'goals': 0, 'possession_percentage': 0, 'touches': 0, 'total_pass': 0, 'total_tackle': 0,
                'total_clearance': 0, 'corner_taken': 0, 'total_offside': 0, 'total_yel_card': 0
            }
            for obj in team['data']:
                if obj['name'] == 'goals':
                    team['stats']['goals'] = obj['value']
                elif obj['name'] == 'possession_percentage':
                    team['stats']['possession_percentage'] = obj['value']
                elif obj['name'] == 'touches':
                    team['stats']['touches'] = obj['value']
                elif obj['name'] == 'total_pass':
                    team['stats']['total_pass'] = obj['value']
                elif obj['name'] == 'total_tackle':
                    team['stats']['total_tackle'] = obj['value']
                elif obj['name'] == 'total_clearance':
                    team['stats']['total_clearance'] = obj['value']
                elif obj['name'] == 'corner_taken':
                    team['stats']['corner_taken'] = obj['value']
                elif obj['name'] == 'total_offside':
                    team['stats']['total_offside'] = obj['value']
                elif obj['name'] == 'total_yel_card':
                    team['stats']['total_yel_card'] = obj['value']

        return self.process_team_data(team1, team2)

The data be sought after will not appear in the JSON response if its value is 0, so I must initialize everything to 0.

def process_team_data(self, team1, team2):
        if team1['stats']['goals'] > team2['stats']['goals']:
            winner = team1
            loser = team2
        elif team1['stats']['goals'] < team2['stats']['goals']:
            winner = team2
            loser = team1
        else:
            return None, None

        winning_team_data = [
            winner['name'], 1, winner['stats']['goals'], winner['stats']['possession_percentage']
        ]
        losing_team_data = [
            loser['name'], 0, loser['stats']['goals'], loser['stats']['possession_percentage']
        ]
        from_json = [
            'touches', 'total_pass', 'total_tackle', 'total_clearance',
            'corner_taken', 'total_offside', 'total_yel_card'
        ]

        for stat in from_json:
            total = winner['stats'][stat] + loser['stats'][stat]
            winning_team_data.append(winner['stats'][stat] / total if total > 0 else 0.5)
            losing_team_data.append(loser['stats'][stat] / total if total > 0 else 0.5)

        return winning_team_data, losing_team_data

This next method takes the team data and determines the winner. I want to ignore draws, so None is returned in this case. Here we are returning values as a percentage of the total. Knowing how many corners a team took, for example, does not seem to me very interesting in itself. What is more interesting is the amount of corners the team took relative to the other team. In the case that both teams took zero corners, their share of the total corners is equal, so I am using 50% in these cases.

Now I update the run method. This will loop through the processes of launching a browser window to grab match IDs for a season and requesting the match-related JSON data for each match.

def run(self):
        data = []
        for season_id in self.season_ids:
            for match_id in self.get_match_ids(season_id):
                (winner_data, loser_data) = self.get_match_data(match_id)
                if winner_data:
                    data.append(winner_data)
                if loser_data:
                    data.append(loser_data)
        self.output_csv(data)

Outputting the Data to a File

The final step is to output a CSV file with all the data. Undoubtedly there is some library that can easily do this for me, but it is pretty simple to do manually if we are not concerned about efficiency.

def output_csv(self, data):
        output = ''
        columns = [
            'name', 'won', 'goals', 'possession', 'touches', 'passes', 'tackles',
            'clearances', 'corners', 'offsides', 'yel_cards'
        ]

        for col in columns:
            output += col + ','
        output = output[:-1] + '\n'

        for row in data:
            for value in row:
                output += str(value) + ','
            output = output[:-1] + '\n'

        with open('data.csv', 'w') as f:
            f.write(output)

After some bug-fixing, the script runs smoothly. It takes some time and eventually outputs a CSV file with all the data.

Analysing the Data

Let's first read in the CSV file and take a look at the structure of the data.

As I explained previously, the values outside of the name and goal columns are all percentages. For example, here we see that West Ham United won its match 1-0 despite making only roughly 35% of the total passes made during the game.

Checking for Inconsistencies and Sanitizing

Just to make sure that there are no null values in the dataset, I will print a list of columns that contain one or more null values.

This outputs an empty list indicating that the table is completely full.

The dataset should contain an equal number of rows for won and lost matches. Let's just verify that.

I would also just like to multiply the values in all columns to the right of possession by 100 so that they are more readable as percentages.

A Look at the Top Winners

Let's take a look at the winrates for each team, ordered from highest to lowest.

Manchester United performs the best over this sample, winning roughly 78.5% of the time while also having played the most matches. In skill-based games such as football, it is to be expected that the identity of the player or team should be a determining factor of the game's likely outcome, simply due to differences in skill level. However, let's attempt to infer other factors related to their success.

The Correlation Matrix

Let's take a look at a heat map of the correlation matrix for the dataset. In other words, what we are looking at is Pearson's R computed for every pair of variables within the dataset. This correlation coefficient ranges between 0 and 1, and we would like to see if there are any interesting cases where the absolute value of R is closer to 1.

However, even if we find such cases, we must be cautious, as correlation does not necessarily imply causation. Further rigorous statistical testing would be required to determine causation, such as a randomized controlled experiment.[1]

Here we see that possession, passes, and touches are all very strongly correlated, with corners being moderately correlated to possession, passes, and touches. Nothing appears to be directly correlated with winning other than goals, which is of course to be expected.

Averages Based on Winrate

Let's try a different approach. I want to first split the dataset into two groups: teams with winrates greater than or equal to 50% and teams with winrates less than 50%. I then want to examine the averages of all columns for these two groups.

Here we do indeed notice some interesting disparities in the averages when we compare high-performing teams to low-performing teams. The greatest disparities are in possession, passes, and corners. We see that the higher-performing teams' average share of the total corner kicks in any given match is roughly 57% compared to not even 46% for the lower-performing teams, for example. It appears likely that factors such as these contribute toward success when taken together.

Winrates When Random Variables Exceed Averages

Let's explore this further. For the metrics of possession, passes, and corners, I will look at the winrate for matches where the metric exceeded the average for high-performing teams. I will first define a function that will draw us some pie charts for better visualisation.

I can now draw some pie charts by filtering based on the whether a metric exceeds the average and then finding the winrates for those filtered series.

We see that the winrates are rather high when these factors exceed the averages for high-performing teams. This demonstrates further evidence that these factors contribute to success. However, it should be noted that further rigorous statistical testing would be required to prove this.

References

1. D. E. Geer Jr., "Correlation Is Not Causation", in IEEE Security & Privacy, vol. 9, no. 2, pp. 93-94, March-April 2011, doi: 10.1109/MSP.2011.26. [URL]